
Python for Data Science: Complete Beginner Tutorial 📊
Ready to unlock the power of data science but don’t know where to start? You’re in the perfect place! Python has become the undisputed champion of data science, powering everything from Netflix recommendations to self-driving cars. This comprehensive guide will take you from complete beginner to confident Python data scientist – no prior experience needed! 🚀
Why Python Dominates Data Science in 2025 💪
Python isn’t just another programming language – it’s the Swiss Army knife of data science. Here’s why millions of data scientists worldwide choose Python:
Simplicity That Doesn’t Compromise Power ⚡ Python reads almost like English, making it incredibly beginner-friendly. You can write powerful data analysis scripts in just a few lines of code that would take dozens of lines in other languages.
Massive Library Ecosystem 📚 With over 400,000 packages available, Python has specialized tools for every data science task imaginable. From web scraping to machine learning, there’s a Python library for that!
Industry Standard 🏢 Companies like Google, Facebook, Netflix, and Uber rely on Python for their data science operations. Learning Python opens doors to career opportunities at the world’s top tech companies.
Active Community Support 🤝 Stuck on a problem? Python’s massive community means you’ll find solutions, tutorials, and help forums everywhere. Stack Overflow has over 2 million Python questions with detailed answers!
Setting Up Your Python Data Science Environment 🛠️
Before we dive into the exciting stuff, let’s get your computer ready for data science magic!
Step 1: Install Anaconda Distribution Anaconda is like getting a complete data science toolkit in one download. It includes Python plus all the essential libraries we’ll use:
- Download Anaconda from anaconda.com (it’s free!)
- Choose the Python 3.11 version for your operating system
- Run the installer and follow the setup wizard
- Launch Anaconda Navigator when installation completes
Step 2: Launch Jupyter Notebook Jupyter Notebook is your data science playground. It lets you write code, see results instantly, and create beautiful reports all in one place:
- Open Anaconda Navigator
- Click “Launch” under Jupyter Notebook
- Your web browser will open with Jupyter’s dashboard
- Click “New” → “Python 3” to create your first notebook
Pro Tip: Jupyter Notebook runs in your browser but works offline. It’s perfect for experimenting with data and sharing your findings!
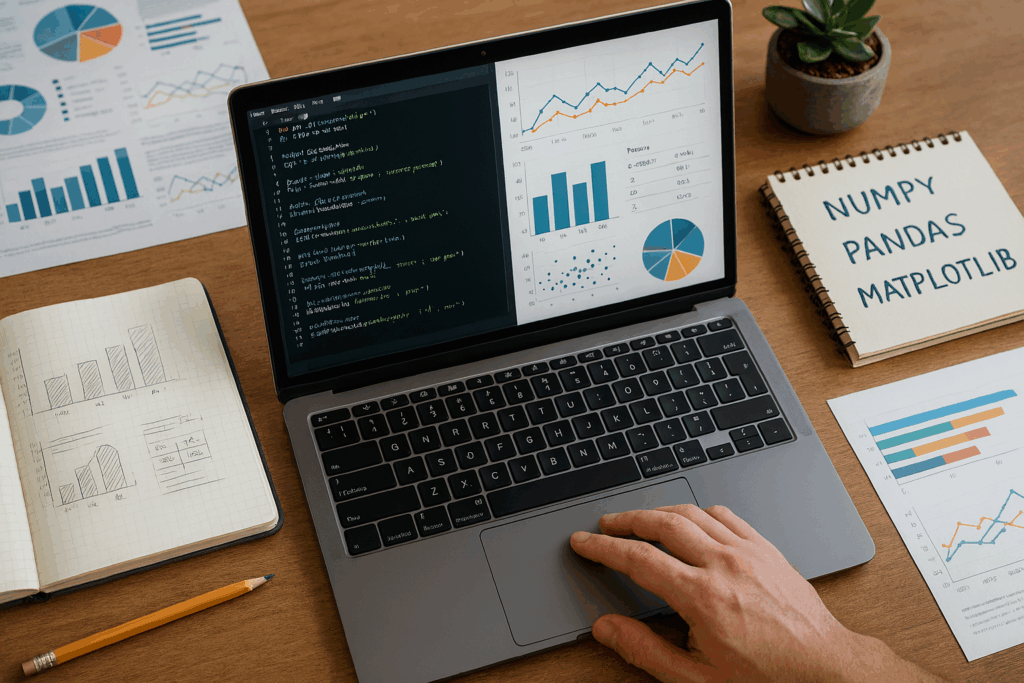
The Data Science Power Trio: NumPy, Pandas, and Matplotlib 🎯
These three libraries form the foundation of Python data science. Master these, and you’ll be able to tackle 90% of data science tasks!
NumPy: The Mathematics Powerhouse 🧮
NumPy (Numerical Python) turns Python into a mathematical superhero. It’s designed for working with arrays and performing blazing-fast mathematical operations.
Why NumPy is Essential:
- Speed: NumPy operations are 50-100x faster than pure Python
- Memory Efficient: Uses less memory than Python lists
- Broadcasting: Perform operations on entire arrays with single commands
- Foundation: Other libraries like Pandas are built on top of NumPy
Real-World Example: Imagine you’re analyzing the daily temperatures for an entire year. With pure Python, you’d need to write loops to calculate the average. With NumPy, it’s just one line:
import numpy as np
temperatures = np.array([23, 25, 22, 28, 30, 27, 24])
average_temp = np.mean(temperatures)  # That's it!
Pandas: The Data Manipulation Master 🐼
If NumPy is your calculator, Pandas is your spreadsheet on steroids. It’s designed for working with real-world, messy data that comes in tables, CSV files, and databases.
Pandas Superpowers:
- DataFrames: Think Excel spreadsheets, but programmable
- Data Cleaning: Handle missing values, duplicates, and inconsistencies
- File Support: Read from CSV, Excel, SQL, JSON, and more
- Grouping and Aggregation: Slice and dice your data any way you want
Real-World Magic: Let’s say you have sales data from your online store. With Pandas, you can:
import pandas as pd
sales_data = pd.read_csv('sales.csv')
monthly_revenue = sales_data.groupby('month')['revenue'].sum()
top_products = sales_data.groupby('product')['quantity'].sum().head(10)
In just three lines, you’ve loaded your data, calculated monthly revenue, and identified your top 10 products!
Matplotlib: The Visualization Wizard 📈
Data without visualization is like a story without pictures. Matplotlib turns your numbers into compelling charts, graphs, and plots that reveal hidden patterns.
Visualization Superpowers:
- Versatility: Create line plots, bar charts, histograms, scatter plots, and more
- Customization: Control every aspect of your plots
- Publication Quality: Generate figures ready for reports and presentations
- Integration: Works seamlessly with Pandas and NumPy
Create Stunning Visuals:
import matplotlib.pyplot as plt
sales_by_month = [10000, 12000, 15000, 18000, 20000, 22000]
months = ['Jan', 'Feb', 'Mar', 'Apr', 'May', 'Jun']

plt.plot(months, sales_by_month, marker='o', linewidth=2)
plt.title('Sales Growth Over Time')
plt.xlabel('Month')
plt.ylabel('Sales ($)')
plt.show()
Your First Data Science Project: COVID-19 Analysis 🦠
Let’s put everything together with a real-world project that demonstrates the complete data science workflow!
Project Goal: Analyze COVID-19 trends to understand the pandemic’s impact.
Step 1: Data Collection
import pandas as pd
import numpy as np
import matplotlib.pyplot as plt

# Load COVID-19 data (from a public dataset)
covid_data = pd.read_csv('covid_data.csv')
print(covid_data.head())
Step 2: Data Exploration
# Check data shape and info
print(f"Dataset shape: {covid_data.shape}")
print(f"Columns: {covid_data.columns.tolist()}")
print(f"Missing values: {covid_data.isnull().sum()}")
Step 3: Data Analysis
# Calculate key metrics
total_cases = covid_data['cases'].sum()
daily_average = covid_data['cases'].mean()
peak_day = covid_data.loc[covid_data['cases'].idxmax(), 'date']

print(f"Total cases: {total_cases:,}")
print(f"Daily average: {daily_average:.1f}")
print(f"Peak day: {peak_day}")
Step 4: Visualization
# Create a trend line
plt.figure(figsize=(12, 6))
plt.plot(covid_data['date'], covid_data['cases'], linewidth=2, color='red')
plt.title('COVID-19 Cases Over Time', fontsize=16)
plt.xlabel('Date', fontsize=12)
plt.ylabel('Number of Cases', fontsize=12)
plt.xticks(rotation=45)
plt.tight_layout()
plt.show()
Congratulations! You’ve just completed a complete data science analysis! 🎉
Essential Libraries for Advanced Data Science 🚀
Once you’ve mastered the basics, these libraries will supercharge your data science capabilities:
Seaborn: Statistical Visualization Built on Matplotlib, Seaborn makes creating beautiful statistical plots effortless. It’s perfect for exploring relationships in your data.
Scikit-learn: Machine Learning The most popular machine learning library for Python. It includes algorithms for classification, regression, clustering, and more.
Plotly: Interactive Visualizations Create interactive charts and dashboards that users can explore. Perfect for web applications and presentations.
Jupyter Lab: Enhanced Development Environment The next generation of Jupyter Notebook with improved interface and features.
Real-World Applications That Will Blow Your Mind 🤯
Netflix Recommendation System 🎬 Netflix uses Python and data science to analyze your viewing history and recommend shows you’ll love. Their algorithm considers viewing patterns, ratings, and content similarity.
Stock Market Analysis 📈 Financial analysts use Python to process massive amounts of market data, identify trends, and make trading decisions. Libraries like Pandas make it easy to analyze stock prices, volumes, and financial indicators.
Healthcare Diagnostics 🏥 Hospitals use Python for medical image analysis, predicting patient outcomes, and drug discovery. Machine learning models can detect diseases from X-rays and MRI scans with superhuman accuracy.
Climate Change Research 🌍 Climate scientists use Python to process satellite data, model weather patterns, and predict climate changes. Organizations like NASA rely heavily on Python for environmental research.
Common Beginner Mistakes (And How to Avoid Them) ⚠️
Mistake 1: Trying to Learn Everything at Once Don’t overwhelm yourself! Focus on mastering NumPy, Pandas, and Matplotlib before moving to advanced topics like machine learning.
Mistake 2: Skipping Data Cleaning Real-world data is messy! Spending time cleaning and preparing your data is crucial for accurate analysis.
Mistake 3: Not Practicing with Real Data Tutorials are great, but working with real, messy datasets teaches you skills you can’t learn from clean examples.
Mistake 4: Ignoring Documentation Python libraries have excellent documentation. When stuck, check the official docs first!
Building Your Data Science Portfolio 💼
Start with Simple Projects Begin with datasets you’re interested in – sports statistics, movie ratings, or stock prices. Passion makes learning easier!
Document Your Process Use Jupyter Notebooks to create reports that show your thinking process, not just results. Employers love seeing your problem-solving approach.
Share Your Work Upload projects to GitHub and write blog posts about your findings. This demonstrates your skills to potential employers.
Leverage AI Tools for Learning Modern AI tools can accelerate your learning process significantly. Our comprehensive guide on Best Free AI Tools for Everyday Users covers essential AI resources that can help you write better code, debug faster, and understand complex concepts more easily.
Join Communities Participate in Kaggle competitions, Reddit data science communities, and local meetups. Networking is crucial for career growth!
Advanced Topics to Explore Next 🎓
Machine Learning Fundamentals Learn supervised learning (prediction) and unsupervised learning (pattern discovery) using Scikit-learn.
Deep Learning with TensorFlow Explore neural networks for image recognition, natural language processing, and more complex predictions.
Big Data with PySpark Handle datasets too large for your computer’s memory using distributed computing.
Web Scraping Collect data from websites using BeautifulSoup and Scrapy libraries.
Career Opportunities in Data Science 💰
Data Scientist ($95,000 – $165,000) Analyze complex datasets to drive business decisions and strategy.
Machine Learning Engineer ($110,000 – $180,000) Build and deploy machine learning systems in production environments.
Data Analyst ($60,000 – $95,000) Focus on descriptive analytics and reporting for business stakeholders.
Research Scientist ($120,000 – $200,000) Conduct advanced research in AI and machine learning at tech companies.
Learning Resources to Accelerate Your Journey 📖
Free Online Courses
- freeCodeCamp’s Python Data Science course (12 hours of hands-on learning)
- Harvard’s Introduction to Data Science with Python
- Kaggle Learn micro-courses
Practice Platforms
- Kaggle: Real datasets and competitions
- DataCamp: Interactive coding exercises
- Google Colab: Free Jupyter notebooks in the cloud
Books for Deep Learning
- “Python Data Science Handbook” by Jake VanderPlas
- “Hands-On Machine Learning” by Aurélien Géron
- “Python for Data Analysis” by Wes McKinney
Communities to Join
- Reddit r/MachineLearning and r/datascience
- Stack Overflow for coding questions
- Local data science meetups
The Future of Python in Data Science 🔮
Python’s dominance in data science continues to grow stronger. With developments in:
Artificial Intelligence Integration AI tools are making Python coding more accessible, helping beginners write better code faster.
Cloud Computing Major cloud providers offer Python-based data science platforms, making powerful computing resources accessible to everyone.
Automated Machine Learning Tools that automatically build machine learning models are making advanced techniques available to non-experts.
Real-time Analytics New libraries enable real-time data processing and analysis, perfect for applications like fraud detection and recommendation systems.
Your Next Steps to Data Science Success 🎯
Week 1-2: Foundation Building Install Anaconda, complete NumPy and Pandas tutorials, create your first Jupyter notebook.
Week 3-4: First Project Choose a dataset you’re passionate about and complete end-to-end analysis with visualizations.
Month 2: Skill Expansion Learn Seaborn for statistical visualization and basic machine learning with Scikit-learn.
Month 3: Portfolio Development Complete 3-5 diverse projects showcasing different skills and create a GitHub portfolio.
Ongoing: Community Engagement Join online communities, participate in competitions, and continue learning advanced techniques.
The Bottom Line: Why Python Data Science Changes Everything 🌟
Learning Python for data science isn’t just about acquiring a new skill – it’s about gaining a superpower that lets you extract insights from the flood of data surrounding us every day. Whether you want to optimize your personal finances, build the next breakthrough app, or solve major world problems, Python gives you the tools to turn data into actionable insights.
The journey from beginner to data scientist might seem daunting, but remember that every expert was once a beginner. The combination of Python’s simplicity, powerful libraries like NumPy, Pandas, and Matplotlib, and the incredible community support makes this the perfect time to start your data science adventure.
Your future self will thank you for taking this first step today. The world needs more people who can speak the language of data, and Python is your gateway to joining this exclusive club. So fire up that Jupyter notebook, load your first dataset, and start discovering the stories hidden in your data! 🚀
Remember, every line of code you write brings you one step closer to becoming the data scientist you want to be. The data revolution is here – are you ready to be part of it?